









- As of late October 2026, every major forecaster tracked in this article favours Democrats to win the House of Representatives, while modelled odds of a Democratic Senate are more divided, ranging from about 56% to 76%.
- The S&P 500 was higher 12 months after each of the 19 midterm elections since 1950, by about 15% on average, though the sample is small and past performance is not necessarily a guide to future performance or returns.
- The 10-year Treasury yield and the US dollar have shown no consistent pattern after midterms, and the average post-election move in the 10-year yield sits within normal variation. Past performance is not necessarily a guide to future performance or returns.
At the midpoint of each four-year presidential term, US voters renew the House of Representatives, about a third of the Senate, and most state governorships.
For investors outside the United States, the 3 November 2026 may be a draw, as news coverage is relentless and a steady stream of polls and forecasts is readily available. That coverage seems to suggest that the result may set the direction of markets, but history shows otherwise.
The most durable pattern, equity strength in the 12 months after a midterm, may well be the consequences of other factors. We will discuss them as well.
Overall, we will quickly go through the 2026 midterm forecasts as of late October and how to read them. We will then discuss the historical market patterns before and after the elections.
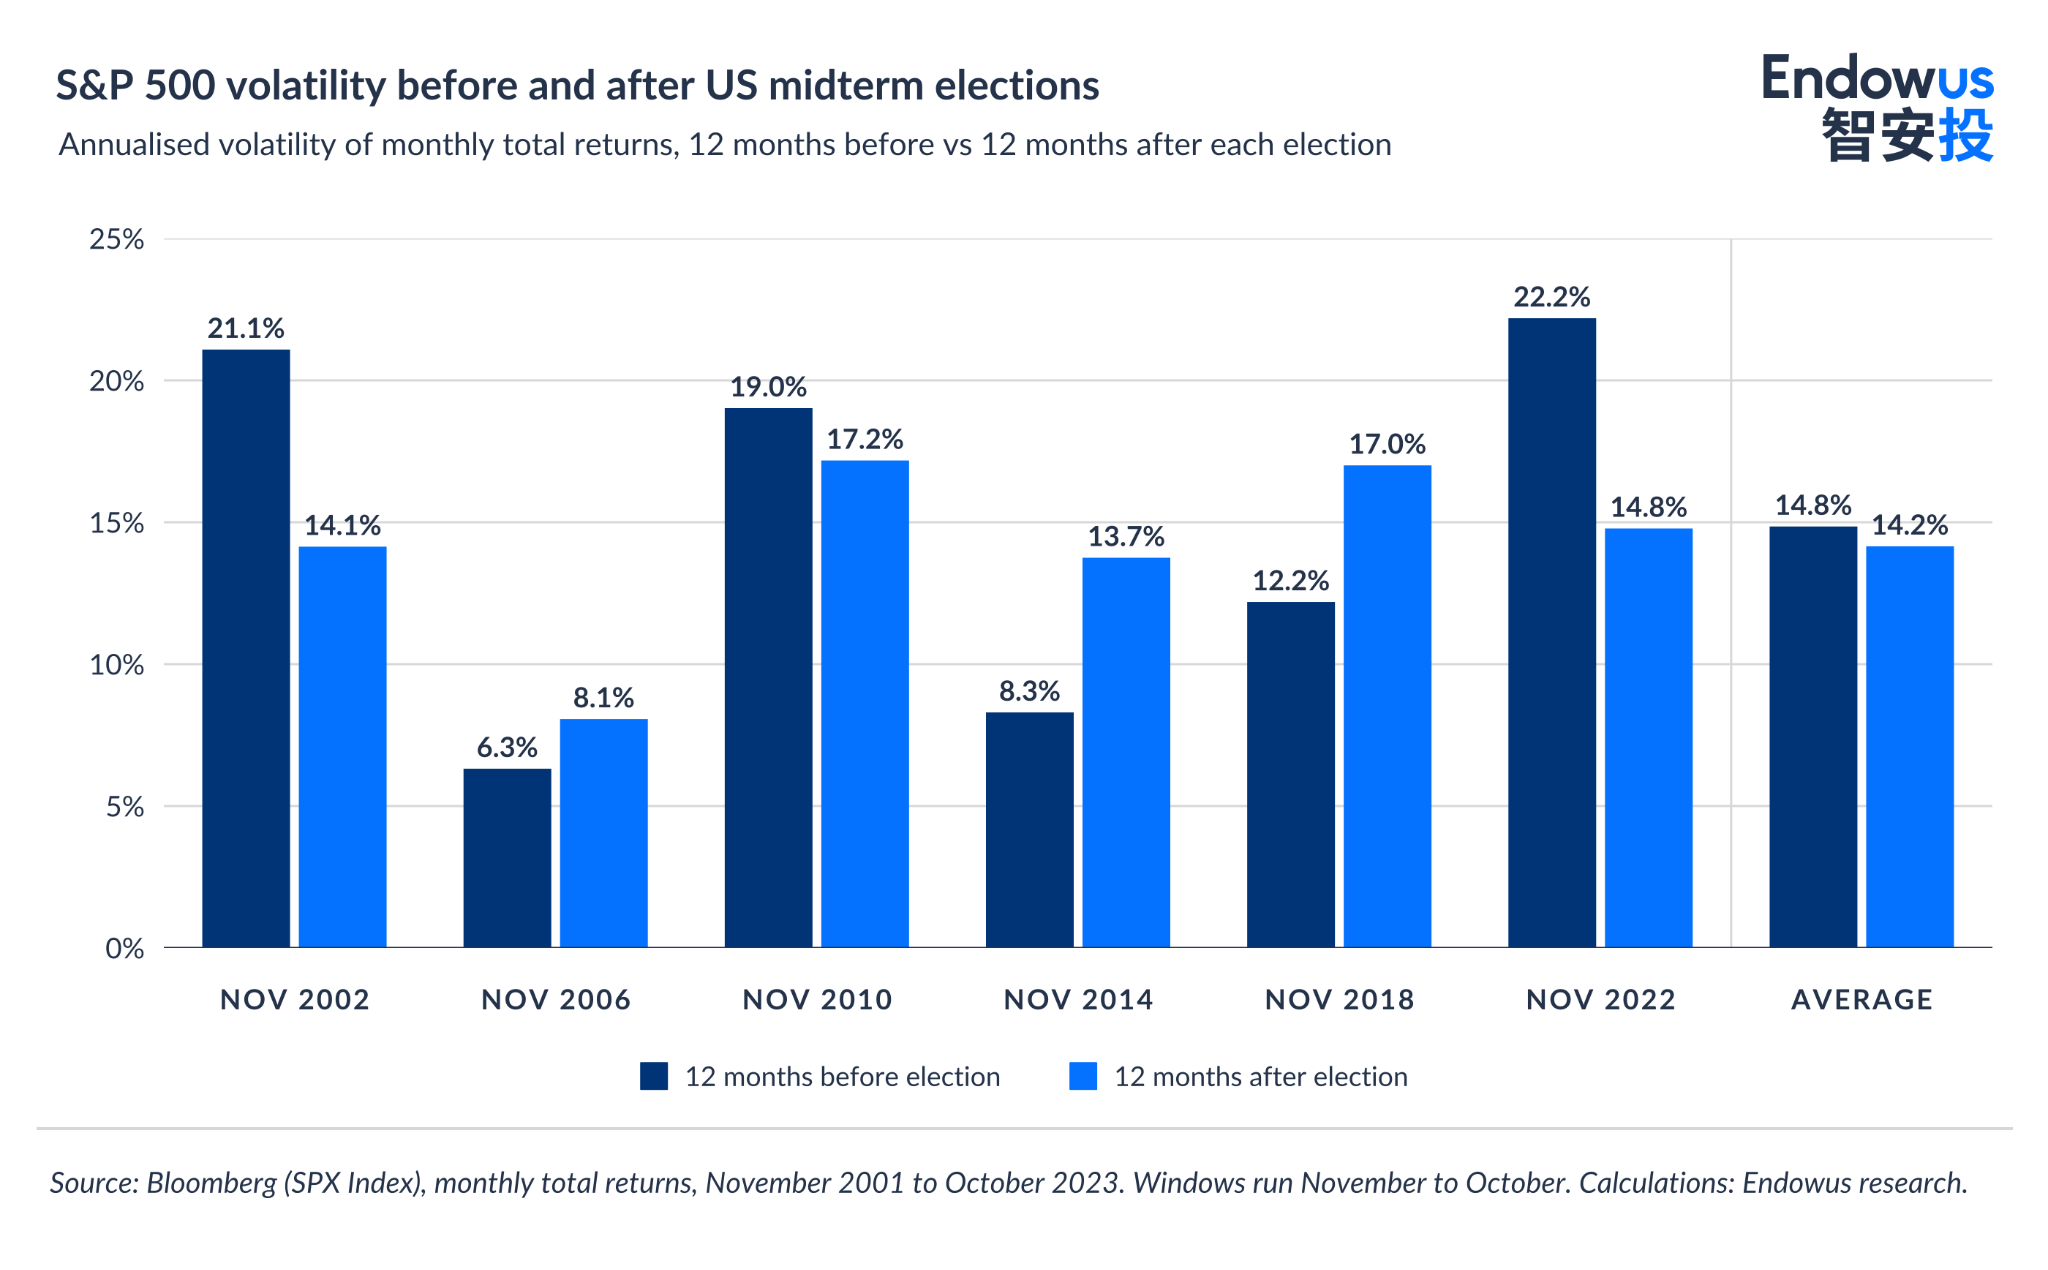
The conclusion is that markets generally perform well after the election results are clear, mainly as a result of the reduction in policy uncertainty. Volatility has also been slightly lower in the year after the midterms, compared to the year leading to the midterms, since 2002.
The president's party almost always loses ground at the midterms
Since 1946, the party holding the White House has lost an average of 25 House seats at the midterms, according to Gallup. The average rises to 37 seats when presidential approval is below 50% and falls to 14 when it is above. The President's party lost House seats in 18 of the 20 post-war midterms, the exceptions being 1998 and 2002.
As a reminder, on November 3 (but early voting has started already in most states) voters will fill all 435 House seats, 35 of the 100 Senate seats, and 36 governorships, with Republicans entering the cycle holding the White House, a 53 to 47 Senate majority, and a narrow House majority. Democrats need a net gain of roughly three to four House seats, and four Senate seats, because the vice president breaks tied votes.
Here’s a quick summary of the forecasts as of the date of this article.
For the House control, the pollsters converge. As of 23 October, The Cook Political Report's likeliest outcome was a Democratic net gain of 12 to 22 seats. Silver Bulletin, the forecast run by Nate Silver, which is updated constantly, put the probability of a Democratic House majority at 95% on 22 October. Decision Desk HQ gave 79% on 25 October.
Senate control is a more complex story. Cook rated seven Senate races as toss-ups on 20 October: Alaska, Iowa, Kansas, Maine, Michigan, Ohio, and Texas. Modelled probabilities of Democratic control ranged from about 56% at Decision Desk HQ to 76% at Silver Bulletin. On 23 October, Cook also rated three of the 36 governorships as toss-ups: Georgia, Nevada, and Wisconsin.
But beware. Forecasts are probabilities attached to outcomes, not statements about the result, And when reputable models differ by 20 percentage points, there is a wide spectrum of potential results.
Forecasts also move quickly. Silver Bulletin's probability of a Democratic Senate rose from roughly 50% in early September to about 76% by 22 October, and its House figure rose from the low 80s to 95% over the same weeks. That means figures may already be stale as this piece is being written.
US equities have risen after every midterm since 1950, on a small sample
The S&P 500 was higher 12 months after each of the 19 midterm elections since 1950, by about 15% on average, according to J.P. Morgan Asset Management. The strength appears on shorter horizons too: BlackRock finds that in the six months after a midterm, the index returned an average of 14.1% since 1970, against 5.7% in non-midterm years.
That isn’t to say much, though, as equities rose also in most of the pre-midterm periods between 2002 and 2022 as well. In fact, if you look at the chart, the two negative years - 2002 and 2022 - coincide with the dot-com bubble and the tech stock derating and inflation surge, respectively. It should be noted that 19 observations (as in the J.P Morgan analysis) is a small base from which to generalise, let alone seven. Past performance is not necessarily a guide to future performance or returns.
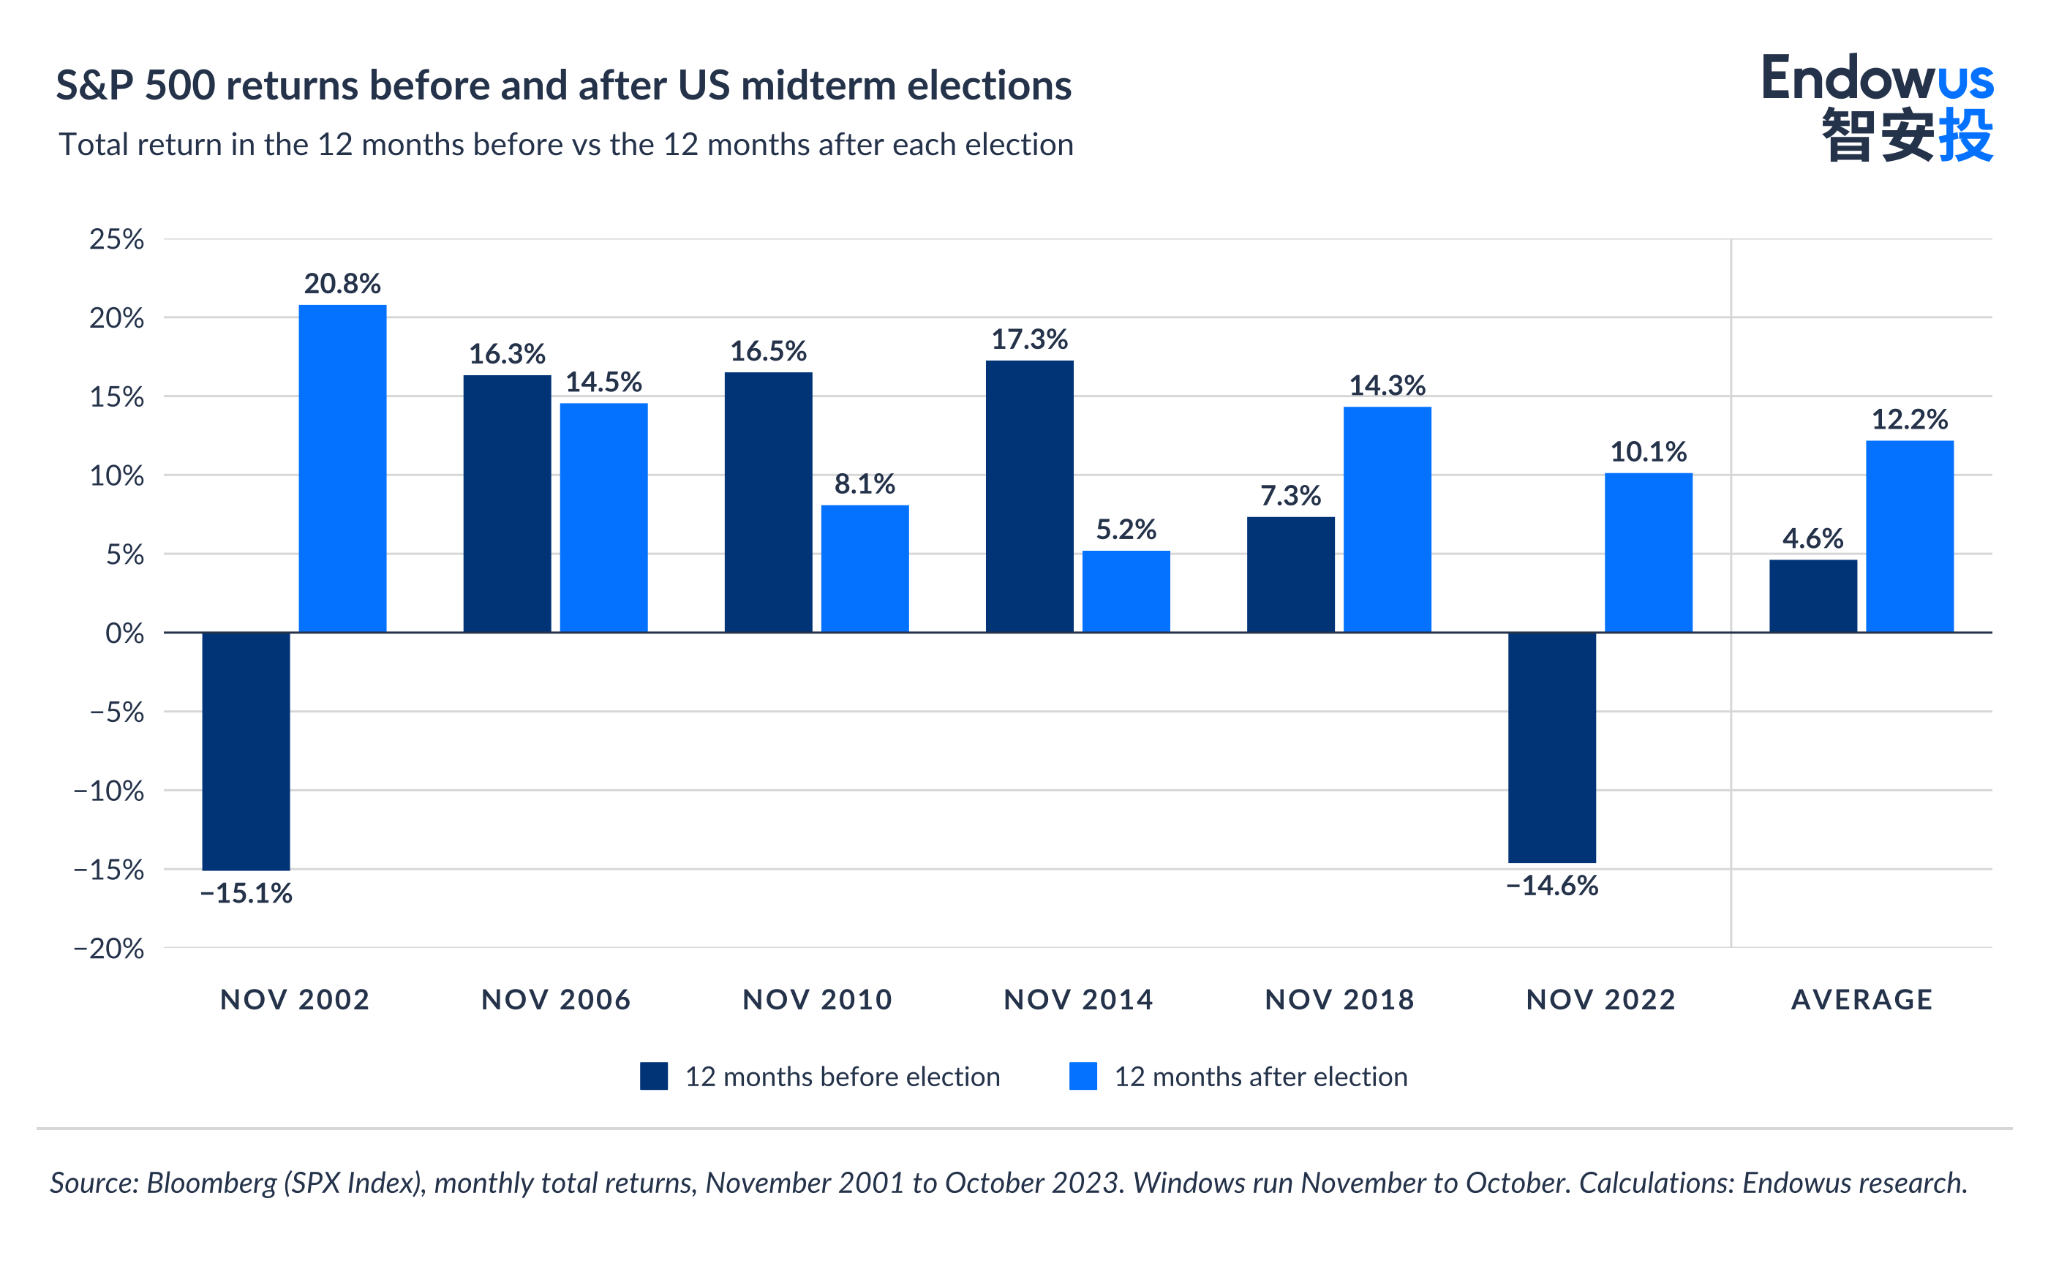
The post-election advance followed midterms in which the president's party gained seats, as in 1998 and 2002, and midterms in which it lost more than 60, as in 2010. And even if the data shows some difference in gains between when at least one chamber changed hands and when neither did, it is hard to infer that the ballot outcome is a strong predictor of performance. Concurrent factors actually matter more.
A commonly cited explanation for post-midterm strength is the resolution of policy uncertainty. Midterm campaigns leave open questions on tax, spending, and regulation until the result is known, and when it is, equities respond to the narrowing of that uncertainty rather than to the direction of policy. But is important to highlight how these mechanisms operate alongside macroeconomic factors. PNC mainly attributes the weak midterm-year market returns of 2002 and 2022 to the end of the dot-com decline and an inflation-and-rate shock respectively, not to the elections.
Treasury yields and the dollar show less pattern than equities
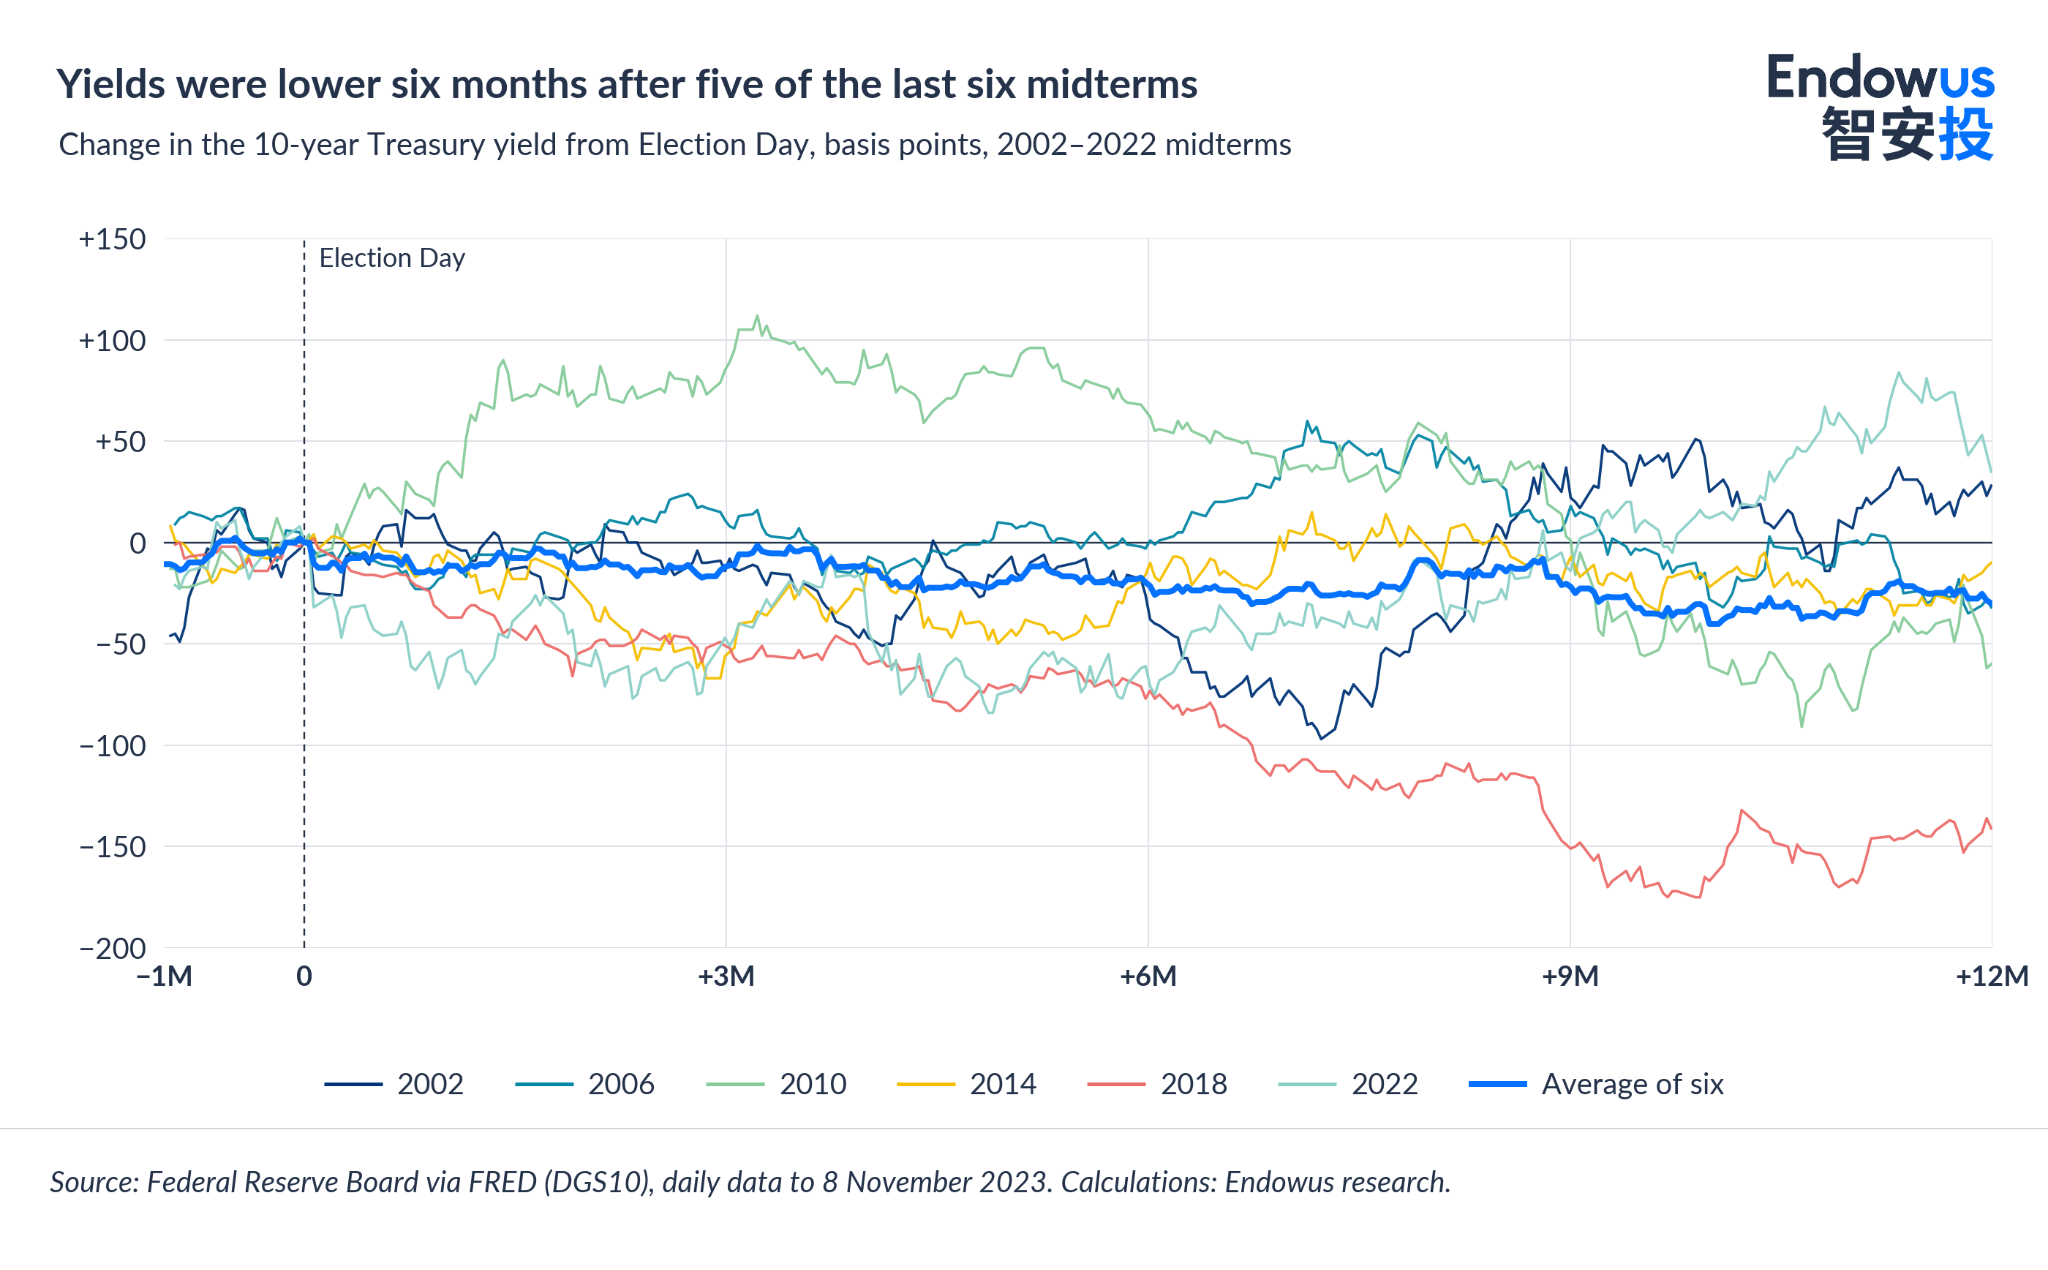
The 10-year Treasury yield has more often fallen than risen after midterms, but the moves have varied too much to call a pattern. Federal Reserve data show the yield lower six months after the vote in five of the six midterms from 2002 to 2022, by 17 basis points (bps) on average. At three months, it was lower in four of six, with a range from −54 bps to +89 bps.
Across monthly samples of three-month windows from 2002 to 2022, the average change was about −1 bp, with a standard deviation of about 45 bps. The post-midterm average of −11 bps therefore sits within normal variation. Analysts point to fiscal policy as the main channel - a divided Congress may limit new spending or tax legislation, although the executive retains some tariff powers under other trade statutes, such as Section 232 of the Trade Expansion Act of 1962 and Section 301 of the Trade Act of 1974.
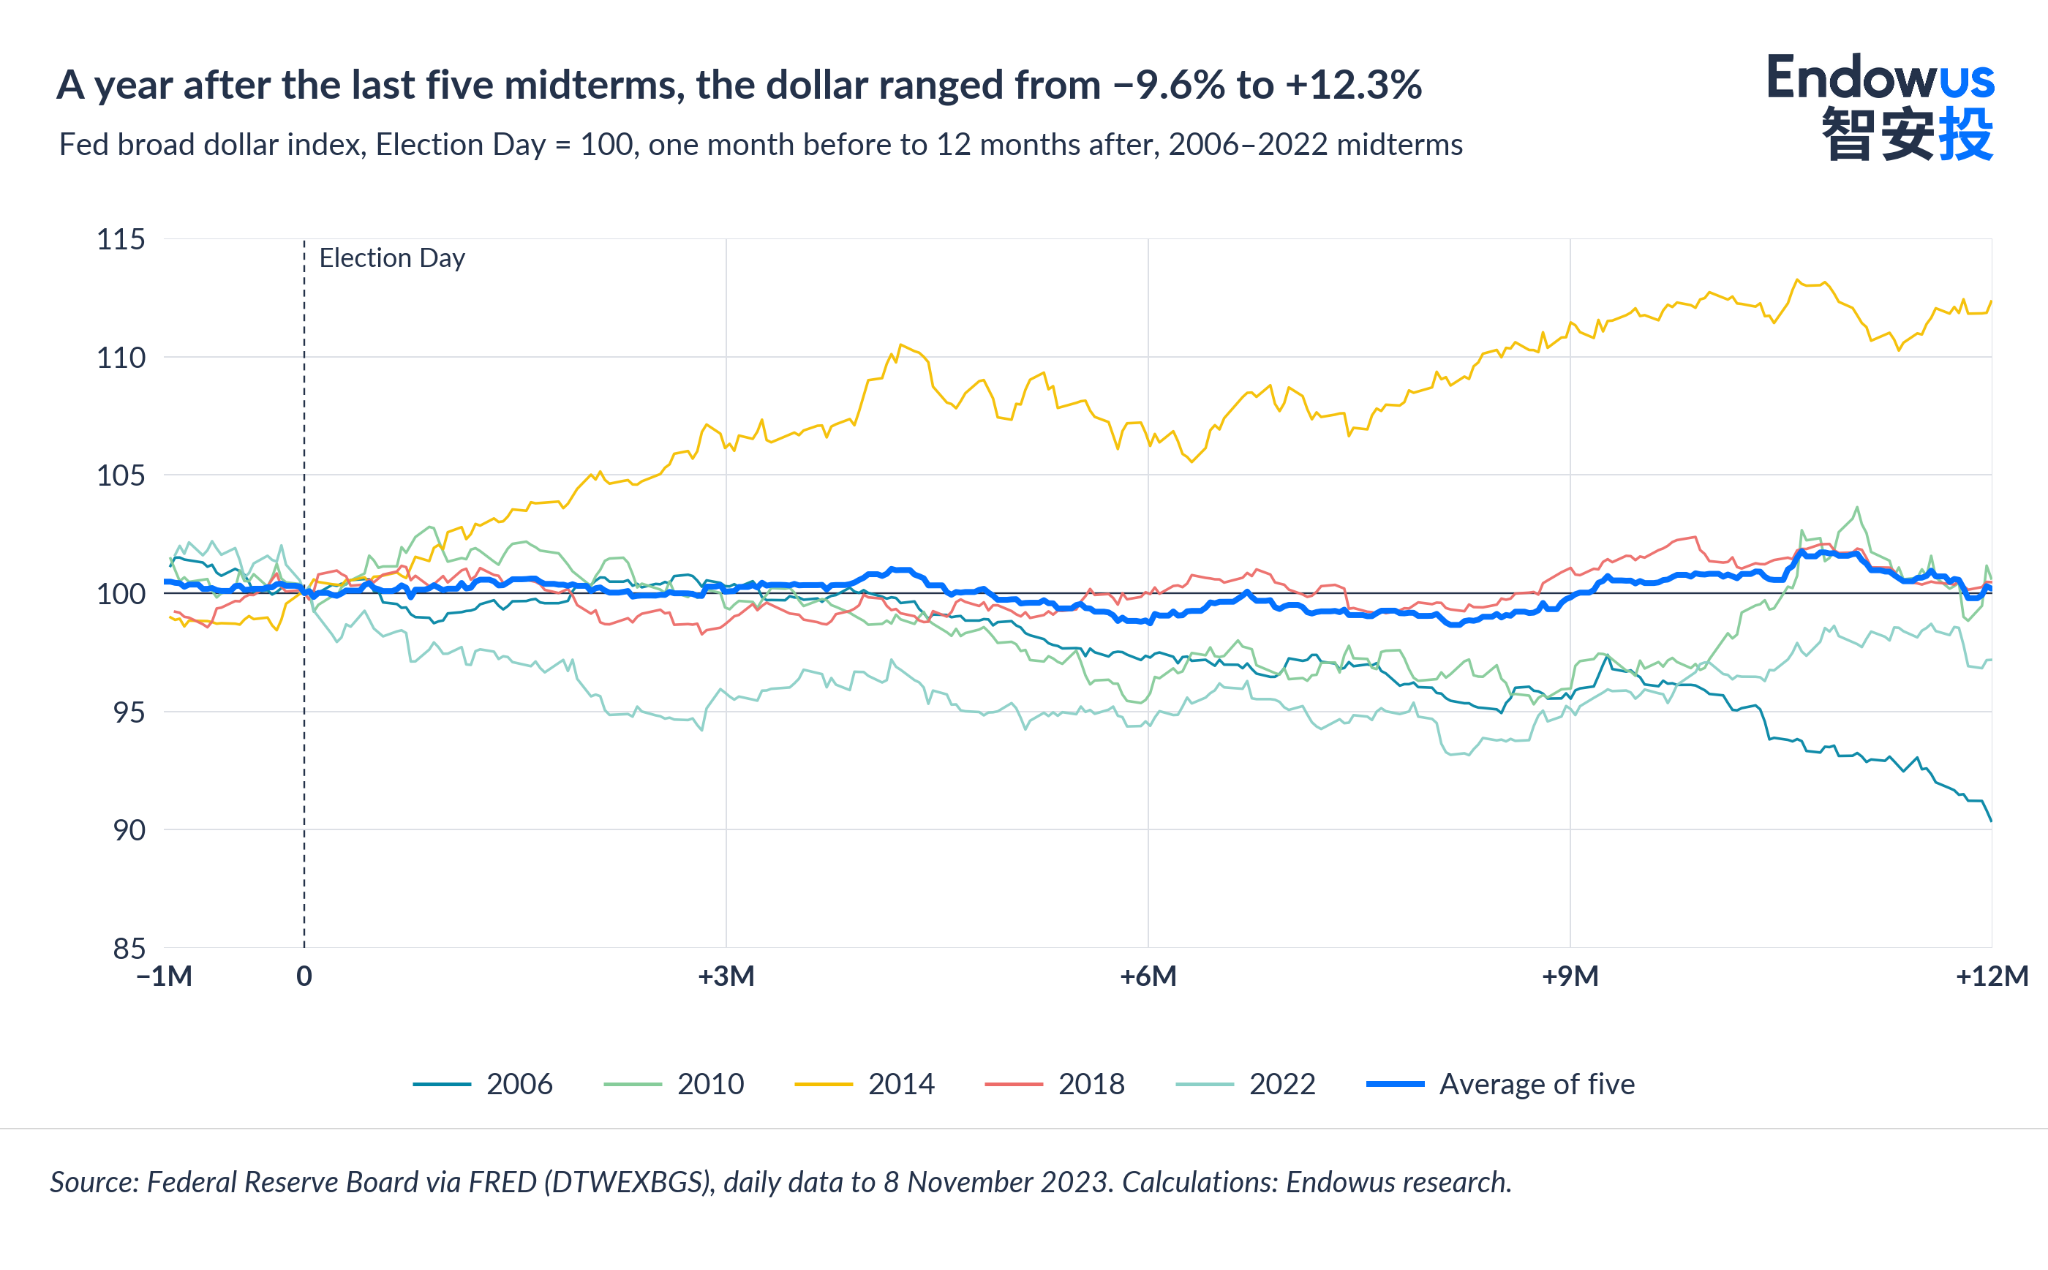
The dollar shows an even less clear pattern. The Federal Reserve’s broad dollar index, a trade-weighted measure covering a wider basket than the six-currency DXY, was lower six months after four of the five midterms from 2006 to 2022, averaging −1.2%. At one, three, and 12 months, the average change was close to zero, and the 12-month range ran from −9.6% to +12.3%. The day after each vote, the index moved by no more than 0.3% in either direction. These are historical observations across five to six cycles, and past performance is not necessarily a guide to future performance or returns.
Entering the vote, the 10-year yield closed at 5.00% on 23 October 2026, after closing at 5.31% on 5 October. The dollar index stood at 121.3 on 23 October, 1.0% above its level a month earlier.
What the record can and cannot tell us
On one hand, post-midterm strength in US equities is consistent on the post-1950 sample and has identifiable drivers: the main one is that policy uncertainty narrows. On the other hand, the sample is small and the macroeconomic backdrop has varied sharply between cycles. Sector leadership weakens once market movement is removed.
The forecasts call for the same discipline. As of late October 2026, the forecasters tracked here favour a Democratic House and give Democrats better-than-even odds in the Senate, with real dispersion between sources. But this doesn’t mean the result is likely or highly probable - it is just a snapshot of the electorate at a given time.
In our view, the midterm result is one input among several for markets, and not a key one. As with any political event, our suggested approach is to ride it out while remaining invested and diversified, and refrain from trading around the result.
Frequently asked questions
When are the 2026 US midterms, and what is on the ballot?
The vote is on 3 November 2026. All 435 House seats, 35 of the 100 Senate seats, and 36 governorships are contested. The presidency is not on the ballot, because midterms fall two years into a four-year presidential term.
Who is expected to win the 2026 midterms?
As of late October 2026, forecasters favour Democrats to win the House. The odds range from 79% at Decision Desk HQ (25 October) to 95% at Silver Bulletin (22 October). The Senate is closer: modelled odds of Democratic control run from about 56% to 76%. These are third-party probabilities, not results, and they move daily.
Do US stocks rise after midterm elections?
They have since 1950. The S&P 500 was higher 12 months after each of the 19 midterms since then, by about 15% on average, according to J.P. Morgan Asset Management. Nineteen observations is a small sample, and stocks rise in most 12-month periods anyway. Past performance is not necessarily a guide to future performance or returns.
Does it matter for markets which party wins?
Less than the coverage implies. Stocks rose after midterms in which the president’s party gained seats, as in 1998 and 2002, and after 2010, when it lost more than 60. Analysts see fiscal policy as the main channel: a divided Congress may limit new spending or tax legislation.
Why have stocks tended to do well after midterms?
A commonly cited reason is that uncertainty narrows. Before the vote, tax, spending, and regulation are open questions. After it, markets can price them.
Disclaimer
Risk Warnings
Investment involves risk. Past performance is not an indicator nor a guarantee of future performance or returns. Projected performance or returns is not guaranteed to materialise. The value of investments and the income from them can go down as well as up, and you may not get the full amount you invested. Rates of exchange may cause the value of investments to go up or down. Individual stock performance does not represent the return of a fund.
General risk warnings relating to collective investment schemes
Before making an investment decision, you are reminded to refer to the relevant prospectus/offering document for specific risk considerations and related fees and charges. Funds are not a bank deposit and not capital guaranteed, and are subject to investment risks, including the possible loss of the principal amount invested. Some of the funds also involve derivatives. Do not invest in them unless you fully understand and are willing to assume the risks associated with them.
Opinions
Any forward-looking statements, prediction, projection or forecast on the economy, stock market, bond market or economic trends of the markets contained in this material are subject to market influences and contingent upon matters outside the control of Endowus HK Limited (“Endowus”) and therefore may not be realised in the future. Further, any opinion or estimate is made on a general basis and subject to change without notice. In presenting the information above, none of Endowus HK Limited, its affiliates, directors, employees, representatives or agents have given any consideration to, nor have made any investigation of the objective, financial situation or particular need of any user, reader, any specific person or group of persons. Therefore, no representation is made as to the completeness and adequacy of the information to make an informed decision. You should carefully consider whether any investment views and products/services are appropriate in view of your investment experience, objectives, financial resources and relevant circumstances. You may also wish to seek financial advice through a financial advisor or the Endowus platform and independent legal, accounting, regulatory or tax advice, as appropriate.
No invitation or solicitation
Nothing contained in this article should be construed as a solicitation, an offer to buy or sell, or recommendation, to acquire or dispose of any security, commodity, investment or to engage in any other transaction in any jurisdiction in which such solicitation, offer to buy or sell would be unlawful under the securities laws in such jurisdiction. No information included in this article is to be construed as investment advice or as a recommendation or a representation about the suitability or appropriateness of any advisory product or service; or an offer to buy or sell, or the solicitation of an offer to buy or sell, any security, financial product, or instrument; or to participate in any particular trading strategy. Investors should seek independent financial and tax advice before making any investment decision.
Product Risk Rating: Please note that any product risk rating (the “PRR”) provided by us is an internal rating assigned based on our product risk assessment model, and is for your reference only. The PRR is subject to change from time to time. The PRR does not take into account your individual circumstances, objectives or needs and should not be regarded as advice or recommendation to purchase, hold or sell any fund or make any other investment decisions. Accordingly, you should not solely rely on the PRR in making your investment decision in the relevant Fund.
Endowus HK Limited (CE No.: BQR225) is licensed by the Securities and Futures Commission of Hong Kong.
This advertisement has not been reviewed by the Securities and Futures Commission or any regulatory authority in Hong Kong.